Wall shear stress on vascular smooth muscle cells exerts angiogenic effects on extracranial arteriovenous malformations
Article information

Abstract
Background
In addition to vascular endothelial cells, vascular smooth muscle cells (VSMCs) are subject to continuous shear stress because of blood circulation. The angiogenic properties of VSMCs in extracranial arteriovenous malformations (AVMs) may exceed those of normal blood vessels if the body responds more sensitively to mechanical stimuli. This study was performed to investigate the hypothesis that rapid angiogenesis may be achieved by mechanical shear stress.
Methods
VSMCs were obtained from six patients who had AVMs and six normal controls. The target genes were set to angiopoietin-2 (AGP2), aquaporin-1 (AQP1), and transforming growth factor-beta receptor 1 (TGFBR1). Reverse-transcriptase polymerase chain reaction (RT-PCR) and real-time PCR were implemented to identify the expression levels for target genes. Immunofluorescence was also conducted.
Results
Under the shear stress condition, mean relative quantity values of AGP2, AQP1, and TGFBR1 in AVM tissues were 1.927±0.528, 1.291±0.031, and 2.284±1.461 when compared with neutral conditions. The expression levels of all three genes in AVMs were higher than those in normal tissue except for AQP1 under shear stress conditions. Immunofluorescence also revealed increased staining of shear stress-induced genes in the normal tissue and in AVM tissue.
Conclusions
Shear stress made the VSMCs of AVMs more sensitive. Although the pathogenesis of AVMs remains unclear, our study showed that biomechanical stimulation imposed by shear stress may aggravate angiogenesis in AVMs.
INTRODUCTION
Vascular anomalies are diseases that affect the surrounding tissues and blood vessels due to changes in blood vessel walls and the endothelium [1]. They can be divided into vascular tumors and malformations according to the International Society for the Study of Vascular Anomalies by Mulliken and Glowacki [2].
Vascular tumors are characterized by an abnormal overgrowth of vascular endothelial cells; however, malformations are based on structural anomalies of the vascular walls without neoplastic proliferation. Vascular malformations are classified into several types according to the specific type of anomalies [3].
An extracranial arteriovenous malformation (AVM) is an abnormal tangle of the vascular system that comprises arteries that connect directly to veins, bypassing the normal capillary network. These shunts consist of a mass of vessels that produce a vascular network called the nidus. Altered hemodynamics develop due to the nidus [4].
AVMs are classified according to the Schobinger staging system by clinical severity. Stage I (quiescence) is a generally asymptomatic state in which the macule is pink/blue. In stage II, mucosal or skin warmth, discoloration and edema, and pulsation are evident. Stage III is characterized by pain, bleeding, ulceration, or skin necrosis. Stage IV lesions are very large, causing increased blood flow, and heart failure (Table 1) [5].
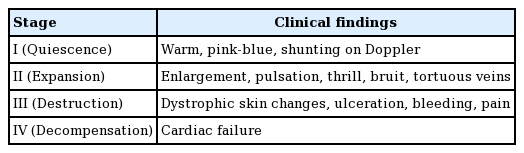
Schobinger staging of arteriovenous malformations
Several studies on the causes of AVM are ongoing, but the results are still uncertain. Five theories to explain the causes of AVMs have been presented: biomechanical activation, extracellular matrix dysregulation, endothelial cell remodeling, hormonal stimulation, and pericyte dysfunction [6]. Of these, biomechanical activation was the focus of this study. Shear stress, which continuously affects vascular walls by blood flow, has been identified as an important biomechanical stimulus.
Our previous study showed that oscillatory shear stress promoted angiogenic effects on the endothelial cells of AVMs [7]. Some studies have found that gene expression in vascular smooth muscle cells (VSMCs) was also affected by mechanical stress. Black et al. [8] reported that cyclic stretching upregulated vascular endothelial growth factor expression via the transforming growth factor-beta 1 (TGF-β1)-dependent activation of NAD(P) H oxidase and increased generation of reactive oxygen species. Anwar et al. [9] found that mechanical stretching modulated the expression of several genes both in vascular endothelial cells and VSMCs. We also hypothesized that VSMCs in AVMs, not endothelial cells, more frequently undergo development in response to mechanical stress than in normal arterial vessels. We therefore conducted the present study to identify abnormal angiogenesis according to oscillating shear stress.
METHODS
This research was approved by the Institutional Review Board of Kyungpook National University Hospital (IRB No. 2018-04-020-007) and was performed in accordance with the principles of the Declaration of Helsinki. All participants provided written informed consent to use their tissue samples.
Six patients with AVMs and six normal controls without AVMs participated in this study. We obtained vascular tissue samples from each participant and extracted VSMCs from the tissue samples. To do so, vascular tissues were washed several times with phosphate-buffered saline and cut into fine pieces. Smooth muscle cell medium (1–2 mL; SMCM Media 1101, ScienCell Research Laboratories, Carlsbad, CA, USA) was added to a 60- well plate, and finely cut tissue pieces were placed into the medium. Most of the medium was then suctioned out of each well, and the samples were fixed for 5–10 days. Subsequently, VSMCs were isolated in an incubator with CO2, and cells were allowed to proliferate continuously. This process was repeated for each participant’s sample. To confirm that the isolated VSMCs were pure, we conducted an additional biological analysis. Immunohistochemistry (IHC) was performed using anti-smooth muscle actin antibody (Actin, Smooth Muscle 1A4 Mouse Monoclonal Antibody; Cell Marque Corp., Rocklin, CA, USA). Three genes— angiopoietin-2 (AGP2), aquaporin-1 (AQP1), and transforming growth factor-beta receptor 1 (TGFBR1)—were identified as the target genes for this study.
In order to establish the settings for oscillating shear stress and time, the degree of change in the shape of cells (M) can be described as M=kft (where k is a constant value, f is force, and t is time). To define f, t should have a consistent value; for our study, it was set to 24 hours. We defined fmin as the minimum shear stress at which the cells began to change shape, and fmax was defined as the maximum shear stress just before the cells were destroyed. Next, we defined tmax as the maximum time during which shear stress could be applied. In order to find the value of tmax corresponding to a change in the cellular shape, VSMCs were observed at 0, 6, 12, 24, 48, and 72 hours after the value of f was set to 4.5 dyn/cm2.
Reverse-transcription polymerase chain reaction (RT-PCR) and real-time PCR were implemented to measure the amount of gene expression at the RNA level. These results were analyzed using the comparative cycle threshold (Ct) method. A detailed description of the comparative Ct method was presented in our previous study [7]. For each target gene, the relative quantity (RQ) value was calculated before and after shear stress was applied. In addition, the condition of shear stress was matched and the RQ values between AVMs and normal vascular tissue were calculated. For a molecular biological comparison, the VSMCs were immunostained to identify the function of VSMCs before and after shear stress was applied to tissue from AVMs and normal arteries. Immunostained VSMCs were observed by a superresolution, highly sensitive, confocal microscope (LSM 800 with AiryScan; ZEISS, Oberkochen, Germany).
To compare the RQ values of gene expression before and after shear stress was applied to both AVM and normal arterial tissues, we conducted the paired t-test. To compare the values of gene expression between tissue from AVMs and tissue from normal arteries, the Student t-test was used. The normality of data distribution was verified using the Shapiro-Wilk test. We used STATA/MP 16.1 (StataCorp, College Station, TX, USA), to perform all analyses; statistical significance was defined as P < 0.05.
RESULTS
The purity of VSMCs was verified by confirming strong expression of smooth muscle actin antibody through IHC. The minimum amount of shear stress needed to deform cells (fmin) was 4 dyn/cm2, whereas the maximum amount (fmax) just before the cells were destroyed was 11 dyn/cm2. Because morphological changes in cells occurred at 4 dyn/cm2, 4.5 dyn/cm2 of shear stress was applied constantly to identify the maximum time (tmax). VSMCs did not exhibit morphological changes after 48 hours. Therefore, tmax was identified as 48 hours, and 7 dyn/cm2 of shear stress, which was the median value between fmin and fmax, was applied for 48 hours (tmax) to all experimental samples (Fig. 1).
Shear stress and time dependent microscopy (×20). (A) The cell structure began to change at 4 dyn/cm2 , and cell destruction occurred at 11 dyn/cm2 . (B) The cells did not exhibit structural changes after 48 hours.
Under the shear stress condition, the mean RQ values of AGP2, AQP1, and TGFBR1 in normal arteries were 2.861 ± 0.822, 1.972 ± 0.411, and 1.181 ± 0.215, when compared with the neutral condition. In AVM tissues, these values were 1.927 ± 0.528, 1.291 ± 0.031, and 2.284 ± 1.461, respectively (Table 2). In the comparison of AVM tissue with normal arteries, the RQ values of AGP2, AQP1, and TGFBR1 were 2.355, 1.295, and 2.117, respectively, in neutral conditions without shear stress and 1.658, 0.879, and 3.329, respectively, under shear stress (Table 3). None of the no-template controls showed a detectable signal (data not shown).
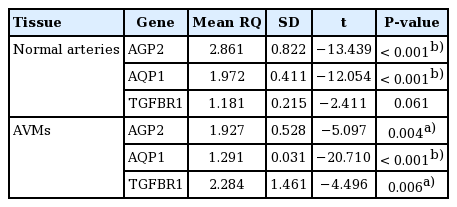
Relative quantification of gene expression in shear force and neutral environments
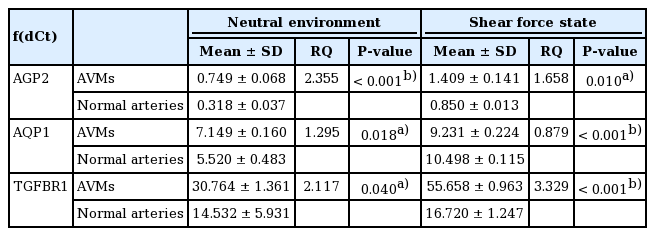
Relative quantification of gene expression in shear force and neutral environments: comparison between AVMs and normal arteries
The staining of AGP2, AQP1, and TGFBR1 was stronger in the cytoplasm of both normal tissue and AVM tissue under shear stress than in neutral conditions. The staining for all three proteins was also stronger in the cytoplasm of AVM tissue than in normal tissue. In the shear stress environments, staining for AGP2 and TGFBR1 was stronger in the AVM tissue than in normal tissue. Regarding the expression of AQP1, no significant differences were found in the degree of fluorescence staining in the cytoplasm between the AVM and normal tissues under shear stress (Fig. 2).
Immunofluorescence for target genes in vascular smooth muscle cells (VSMCs) (confocal). (A) Angiopoietin-2 (AGP2) expression in the cytoplasm increased in both normal arterial vasculature and tissue from arteriovenous malformations (AVMs) to a greater extent under shear stress than in neutral conditions. Protein expressions increased under neutral and shear stress more in AVMs than in normal arteries. (B) Aquaporin-1 (AQP1) expression in cytoplasm increased in both normal arterial vasculature and AVMs to a greater extent under shear stress than in neutral conditions. In neutral conditions, protein expression increased more in AVMs than in normal arteries. We found no significant differences in staining between AVMs and normal arteries under shear stress. (C) Transforming growth factor-beta receptor 1 (TGFBR1) expression in the cytoplasm increased in both normal arterial vasculature and in AVM tissues to a greater extent under shear stress than in neutral conditions. Protein expression increased in neutral conditions and under shear stress to a greater extent in AVMs than in normal arteries. Scale bars, 10 μm.
DISCUSSION
We studied the effect of shear stress on angiogenesis with regard to AVMs. The results consistently indicated that shear stress promotes angiogenesis, which can result in AVMs. The expression of AGP2, AQP1, and TGFBR1 was higher under shear stress than in neutral conditions. Furthermore, the expression of AGP2 and TGFBR1 was also higher in AVMs than in normal arteries under shear stress. To identify angiogenesis that results in AVMs, we evaluated the expression of these three genes for several reasons. First, because AVMs are related to genetic mutations, we performed a microarray analysis to identify differential gene expression (data not shown). We chose genes that had differential expression results in common with vascular endothelial cells. This choice was influenced by our hypothesis that both VSMCs and endothelial cells are influenced by shear stress and promote angiogenesis. Furthermore, some studies have shown that the products of these three genes play roles in angiogenesis. AGP2 is a ligand for tyrosine kinase receptor 2 and contributes to angiogenesis [10]. AGP2 promotes angiogenesis of several vessels, as well as pathological angiogenesis [11,12]. AQP1 is known as an osmolarity-driven water transporter [13]. Some reports have revealed that AQP1 was expressed at the time of microvascular proliferation, especially associated with tumors [14-16]. AQP1 expression is necessary for hypoxia-induced angiogenesis [17]. TGF-β also contributes to angiogenesis. One study revealed that TGF-β was related to cardiovascular problems and angiogenesis [18]. Other studies demonstrated that dysfunctional TGF-β signaling can cause vascular malformations and affect the activation and regulation of angiogenesis [19]. However, under shear stress, the expression of AQP1 was not higher in AVMs than in normal arteries in this study. This may indicate contradictory results, or perhaps AQP1 expression may not reflect the angiogenesis that leads to AVMs. In other studies, AQP1 was related to tumor angiogenesis; however, AVMs are vascular malformations, not tumors.
As mentioned in our previous study, because blood passes through an artery, shear stress is always applied to the arterial wall. This concept is expressed by the Hagen–Poiseuille equation [7]. According to other reports, the Hagen–Poiseuille equation was described as WSS= 32 μQ/πD3, where WSS= wall shear stress (dyn/cm2), D = blood vessel diameter (cm), Q = blood flow rate (mL/s), and µ = blood viscosity (0.035 poise) [20,21]. If a greater amount of blood passes through vessels, more shear stress is exerted on the vascular walls, according to this equation. VSMCs are one of several types of vascular cells that form the vascular wall. Because blood always flows through vessels as a result of heart contractions in living humans, shear stress always occurs on vascular walls. VSMCs are also affected by shear stress on vascular walls.
In conclusion, this study revealed that the VSMCs of AVMs also showed a high response to oscillatory shear stress, and VSMCs of AVMs exhibited more angiogenic properties than did those of normal arteries both in neutral conditions and under shear stress. These findings constitute evidence that biomechanical stimulation leads to pathological abnormal angiogenesis, which can result in aggravation of AVMs.
Notes
Conflict of interest
Ho Yun Chung is an editorial board member of the journal but was not involved in the peer reviewer selection, evaluation, or decision process of this article. No other potential conflicts of interest relevant to this article were reported.
Ethical approval
The study was approved by the Institutional Review Board of Kyungpook National University Hospital (IRB No. 2018-04- 020-007) and performed in accordance with the principles of the Declaration of Helsinki. Written informed consent was obtained.
Author contribution
Conceptualization: S Huh. Data curation: JY Ryu, TH Park, EJ Oh, HM Kim, SJ Lee, J Lee, SY Lee, JY Kim, S Im. Formal analysis: JY Ryu, EJ Oh, HM Kim, SY Lee, S Im. Funding acquisition: HY Chung. Methodology: TH Park, HM Kim, S Im. Project administration: JS Lee, HY Chung. Visualization: JS Lee. Writing - original draft: JY Ryu, TH Park, JS Lee. Writing - review & editing: SJ Lee, J Lee, S Huh, JY Kim, HY Chung. All authors read and approved the final manuscript.